Average Temperatures
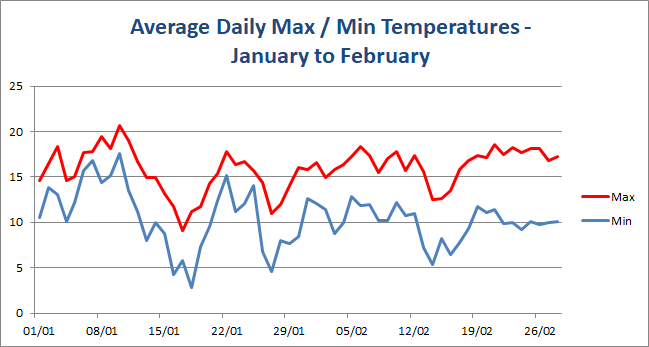
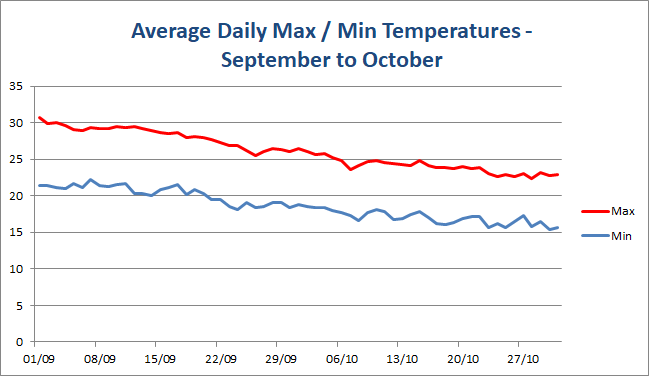
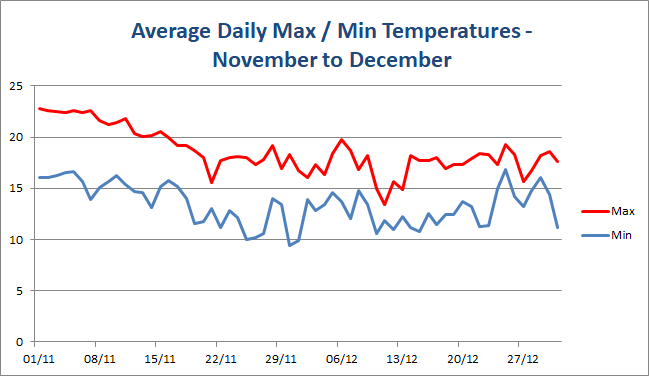
The following charts show the average "shade" temperatures that we have
recorded at our house since March 2013. (NB. The November/December graph
only encompasses 2020 values as this was the only year we stayed in Corfu
during the winter, while the January & February graph only
includes 2021 and 2022 values).


